Digital PSI Monitoring System
Project Overview
This project addresses the challenge of continuous environmental monitoring for vehicles, particularly in off-road or long-distance travel where real-time data on internal and external conditions is critical for safety and performance. Utilizing an Arduino microcontroller, multiple sensors, and an intuitive OLED display, the system provides comprehensive monitoring by measuring and displaying real-time data for interior and exterior temperature, humidity, and pressure, tank pressure for onboard air systems, vehicle pitch and roll, and altitude. Additionally, the system visualizes trends over time, offering users valuable insights into environmental and system conditions.
This project was chosen to support off-road enthusiasts, frequent travelers, and field operators who require reliable and accurate data to ensure safety and operational efficiency. Automated monitoring enhances real-time decision-making, improves accuracy, and provides convenient data visualization, minimizing manual checks and reducing the risk of human error. Simplifying assumptions include pre-calibrated sensors, stable environmental conditions, fixed sensor configurations, and a reliable power supply, ensuring seamless system operation. By integrating all necessary data into a single display, this project delivers a practical, efficient, and reliable solution for monitoring vehicle and environmental parameters in demanding conditions.

System Components
- Microcontroller: Arduino Nano
- Interior Sensor (BME280): Measures temperature (-40–85°C), humidity (0–100% RH), and pressure (300–1100 hPa)
- Exterior Sensor (BME280): Measures temperature, humidity, and atmospheric pressure outside the vehicle
- Tank Pressure Transducer (HW-Series): Analog voltage (0.5–4.5V) mapped to 0–200 PSI
- IMU Sensor (LSM6DS3): Measures vehicle pitch (±90°) and roll (±90°)
- OLED Display (Adafruit SSD1306): Displays real-time data and graphical representations
System Functionality

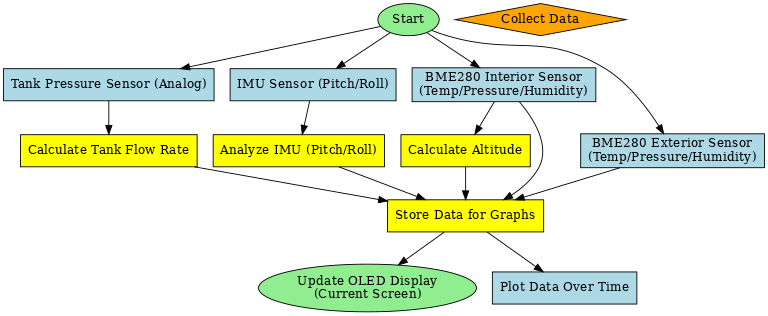
The system follows a structured process:
- Initialize all components and perform a self-check
- Measure interior and exterior temperature, humidity, and pressure
- Measure tank pressure and convert voltage to PSI
- Read pitch and roll data using the IMU
- Calculate altitude based on pressure differentials
- Log historical data for trend visualization
- Update OLED display with live sensor values
Inputs:
- Interior Environment Sensor: Adafruit BME280
- Physical Function: Measures the temperature, humidity, and atmospheric pressure inside the vehicle.
- Input Signal Type: Analog voltage for temperature, humidity, and pressure readings.
- Assigned Label: InteriorBME.
- Exterior Environment Sensor: Adafruit BME280
- Physical Function: Measures the temperature, humidity, and atmospheric pressure outside the vehicle.
- Input Signal Type: Analog voltage for temperature, humidity, and pressure readings.
- Assigned Label: ExteriorBME.
- Tank Pressure Transducer: HW-Series Pressure Transducer
- Physical Function: Monitors the pressure of the onboard air system.
- Input Signal Type: Analog voltage, scaled to represent 0–200 PSI.
- Assigned Label: TankPressure.
- IMU Sensor: Arduino Nano LSM6DS3
- Physical Function: Measures the vehicle's pitch and roll for off-road navigation and stability monitoring.
- Input Signal Type: Analog voltage proportional to acceleration in three axes.
- Assigned Label: IMUSensor.
Outputs:
- OLED Display: Adafruit SSD1306
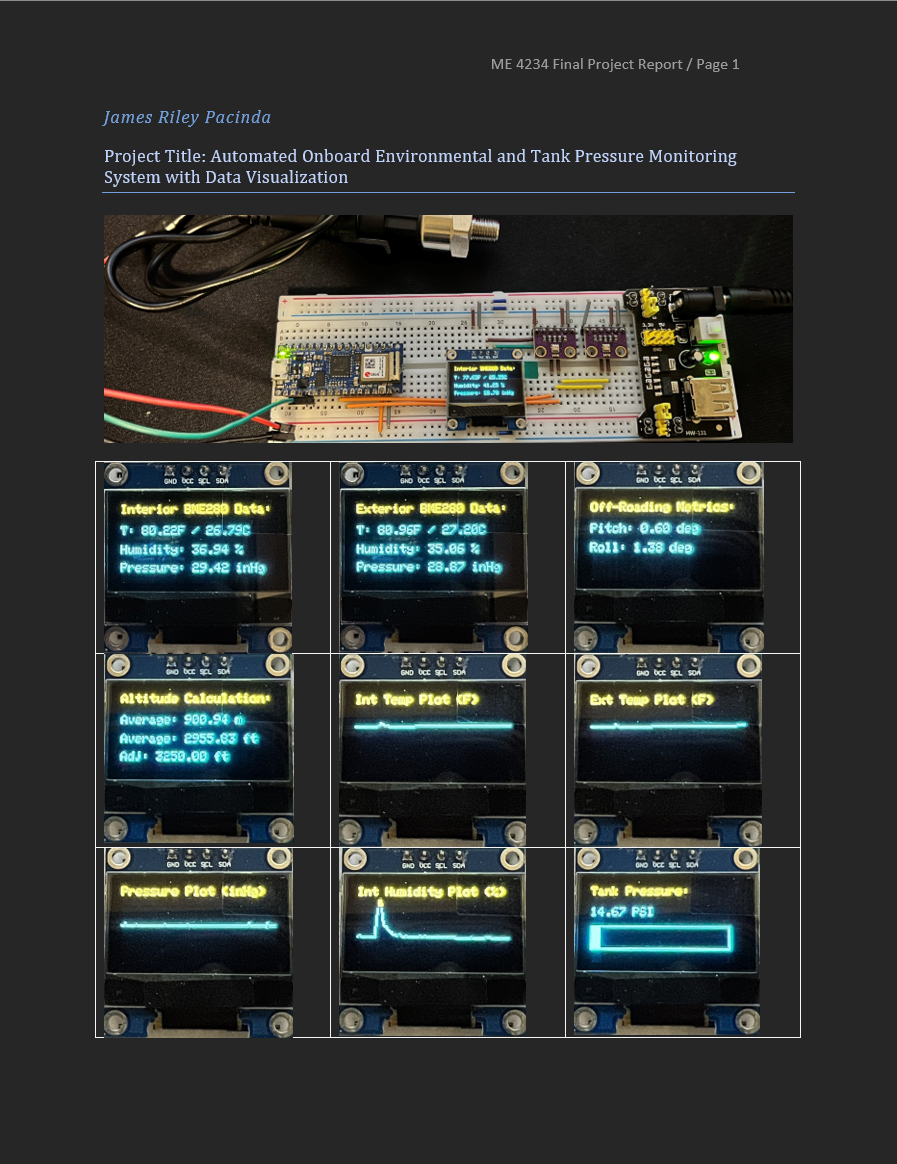
- Physical Function: Displays real-time data, including interior and exterior temperature, humidity, atmospheric pressure, tank pressure, pitch, roll, and altitude. The display also visualizes historical trends for temperature, pressure, and humidity using line plots.
- Output Signal Type: I²C digital communication for text, graphical updates, and UI rendering.
- Assigned Label: OLED_Display.
- Graphical Pressure Gauge
- Physical Function: Displays a bar graph representation of the tank pressure (0–200 PSI) on the OLED screen, providing a visual reference for the current pressure level.
- Output Signal Type: Digital graphical rendering via the OLED display.
- Assigned Label: PressureGauge.
- Temperature, Pressure, and Humidity Live Data Pages
- Physical Function: Outputs live numerical data for both interior and exterior sensors on the OLED display. This includes temperatures in Fahrenheit and Celsius, atmospheric pressure in inHg, and humidity as a percentage.
- Output Signal Type: Digital numerical values displayed through I²C communication to the OLED.
- Assigned Label: LiveDataOutput.
System Functionality

- Initialize System Components:
- Power up the Arduino and initialize all peripherals, including the OLED display, BME280 sensors, and IMU sensor.
- Perform a self-check to ensure all sensors and the display are communicating properly.
- Measure Interior Sensor Data:
- Read temperature, humidity, and atmospheric pressure from the interior BME280 sensor.
- Calculate the temperature in Fahrenheit and Celsius.
- Convert pressure to inHg.
- Measure Exterior Sensor Data:
- Read temperature, humidity, and atmospheric pressure from the exterior BME280 sensor.
- Calculate the temperature in Fahrenheit and Celsius.
- Convert pressure to inHg.
- Measure Tank Pressure:
- Read the analog voltage from the tank pressure sensor.
- Convert the voltage to a pressure value in PSI and inHg.
- Read Vehicle Orientation:
- Retrieve pitch and roll angles using the onboard IMU.
- Calculate Altitude:
- Retrieve altitude data from both BME280 sensors (interior and exterior).
- Calculate the average altitude and apply correction factors to ensure accuracy.
- Log Historical Data:
- Record interior and exterior temperature, humidity, and atmospheric pressure for plotting historical trends.
- Update data arrays for visualization.
- Display Live Data Pages:
- Cycle through live data pages for interior and exterior temperature, humidity, pressure, tank pressure, and off-roading metrics.
- Render bar graphs for tank pressure and line plots for historical temperature, pressure, and humidity trends.
- Repeat Process:
- After cycling through all data pages, return to the first page and continue collecting and displaying data in real time.
Final Implementation

The system underwent extensive testing to validate its performance and functionality. Initial tests focused on system initialization and sensor verification, ensuring that the BME280 sensors provided consistent environmental data and that the IMU accurately reported pitch and roll values in response to orientation changes. Tank pressure calibration was conducted by comparing readings from the system to a calibrated analog gauge, with discrepancies corrected using an altitude-based correction factor. Data logging and plotting functionality were verified by monitoring and recording temperature, pressure, and humidity data over a 30-minute period, demonstrating smooth updates and transitions between screens without disruptions. Altitude calculations were assessed by comparing sensor readings to the known elevation of the test location (3250 ft), with adjustments yielding an accuracy of ±3 ft. Real-time performance tests validated the responsiveness of live data displays and pitch/roll measurements, with data updating with minimal latency (~0.2 seconds). Measurement errors and uncertainties, such as altitude variations due to atmospheric pressure changes, minor nonlinearities in pressure transducer readings, and potential sensor drift, were identified but deemed minimal for the system's intended application. Overall, the system delivered accurate and efficient monitoring of environmental and system parameters, meeting the project’s objectives effectively.