Tribometer Research – PAO & Ionic Liquid Lubrication
Project Summary
I contributed to an undergraduate research effort evaluating how base oils and ionic-liquid systems, with and without graphene-derivative additives, affect friction and wear on bearing steel. We used a ball-on-flat reciprocating tribometer (RFW160) to capture time-resolved coefficient of friction (CoF) and post-test wear metrics (profilometry), while a parallel team built a machine-learning model to predict nonlinear, time-dependent tribological behavior.
My Contributions
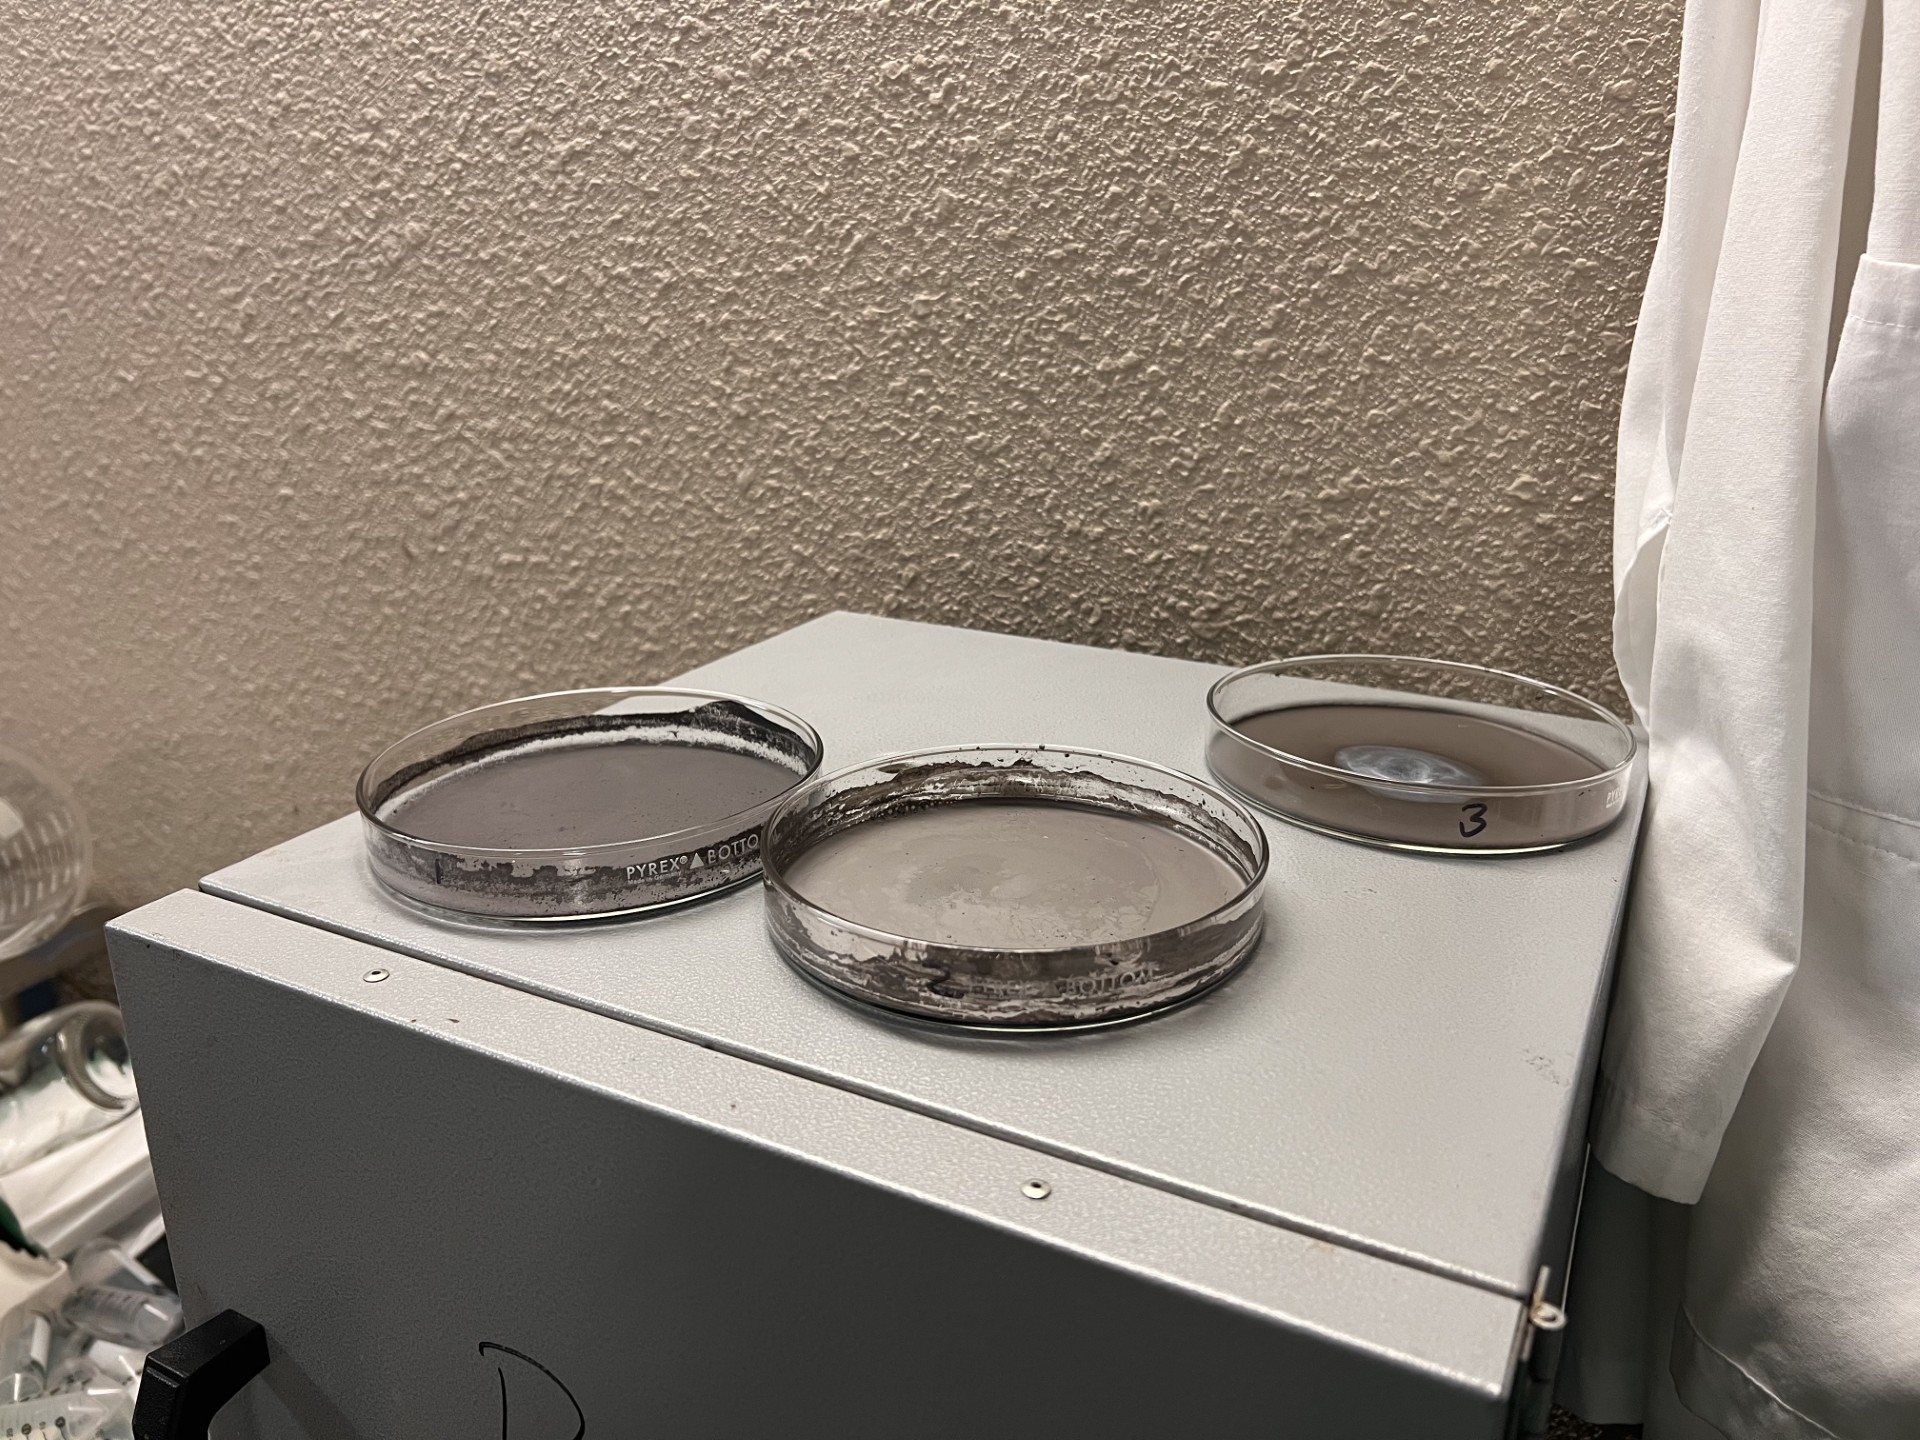
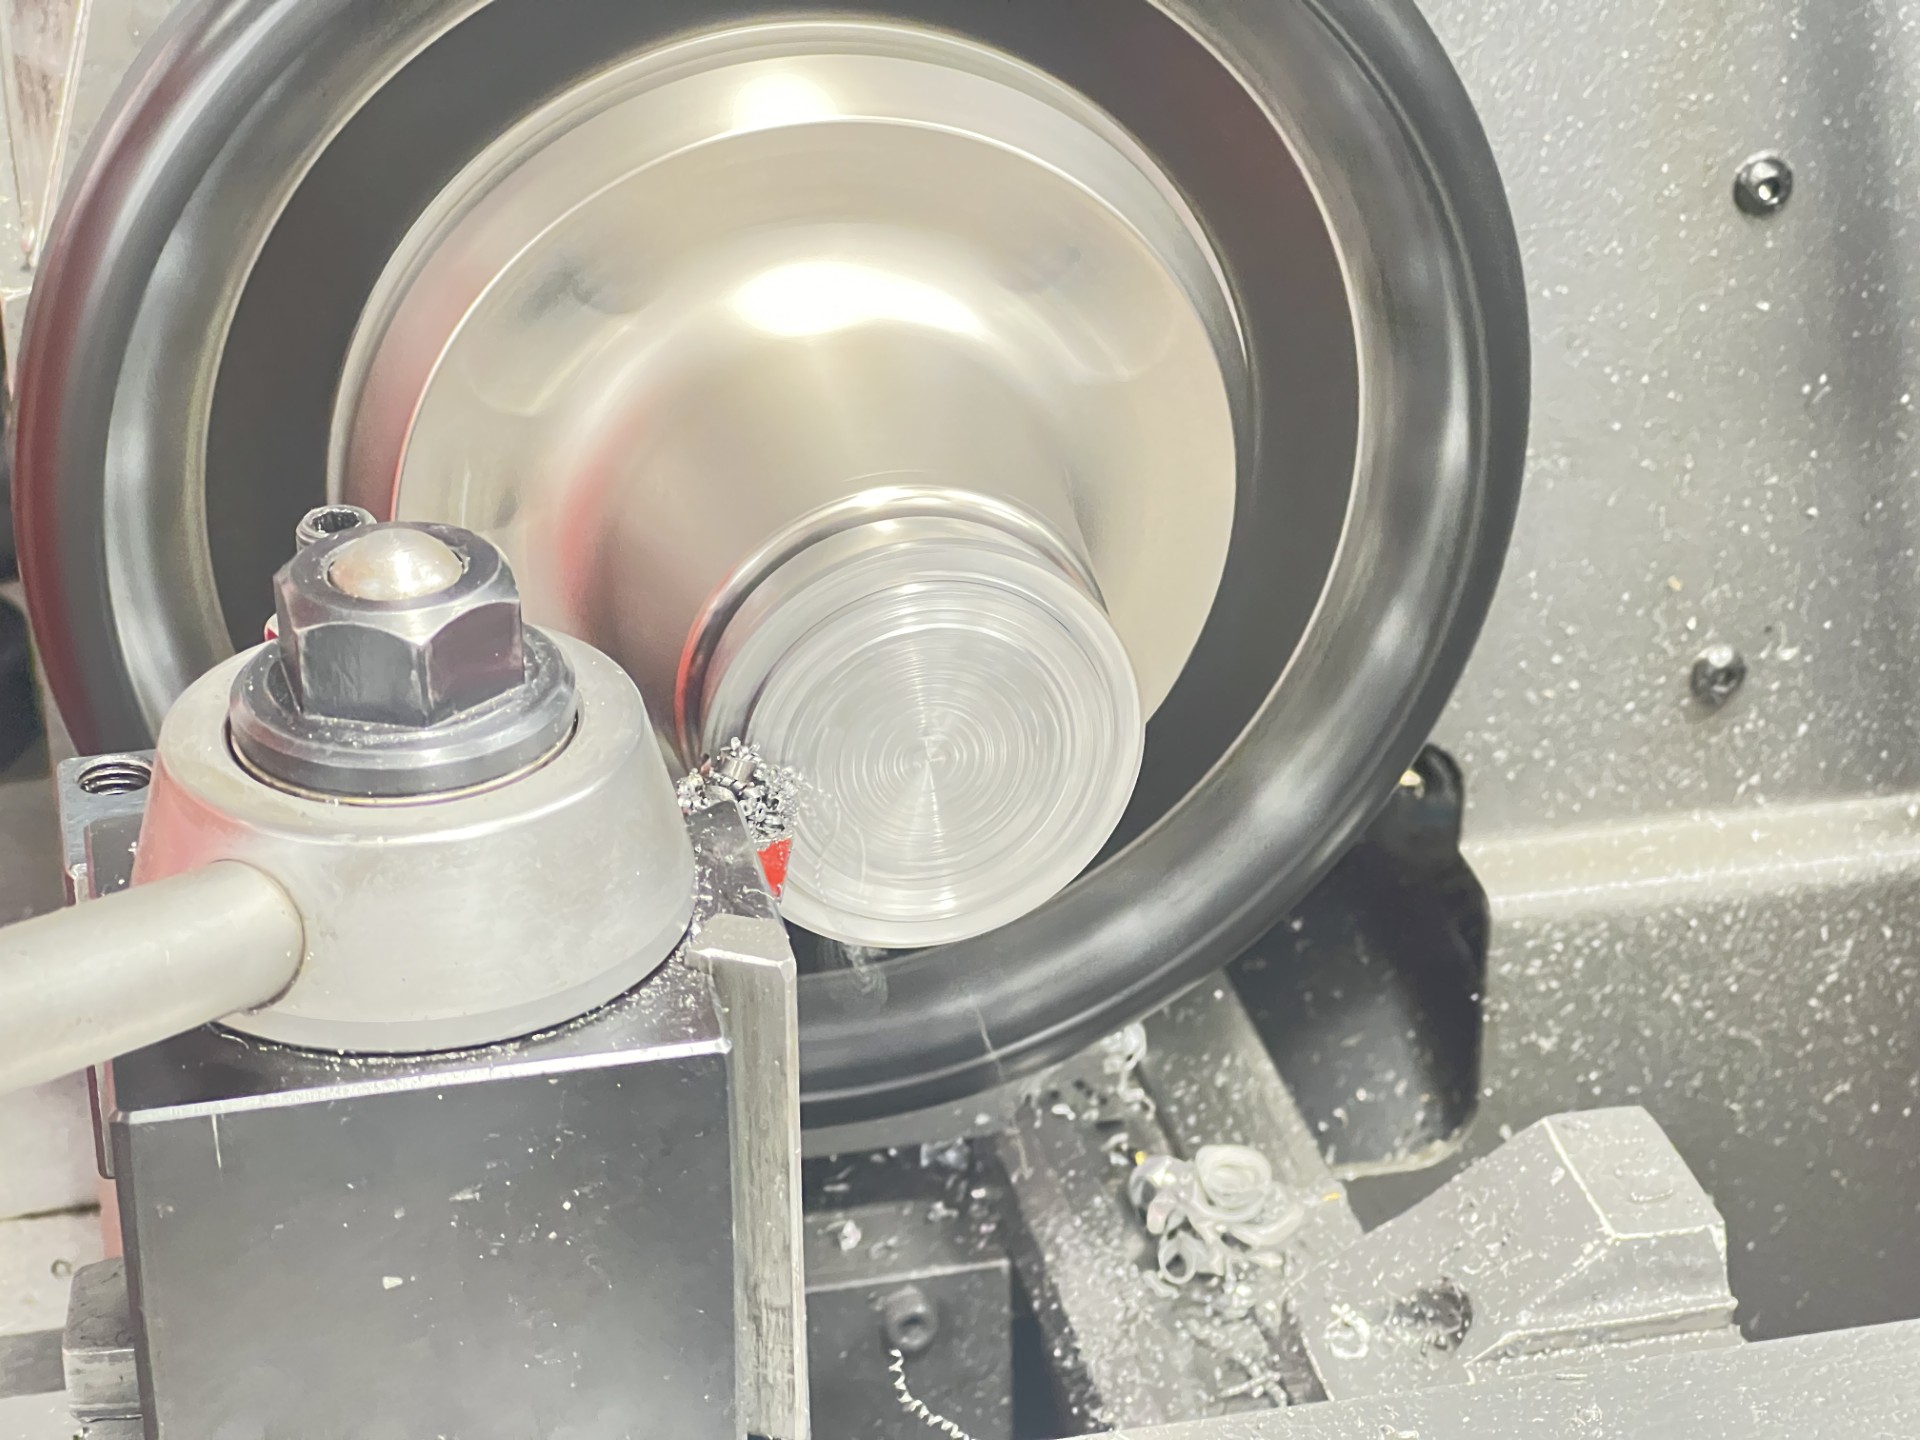
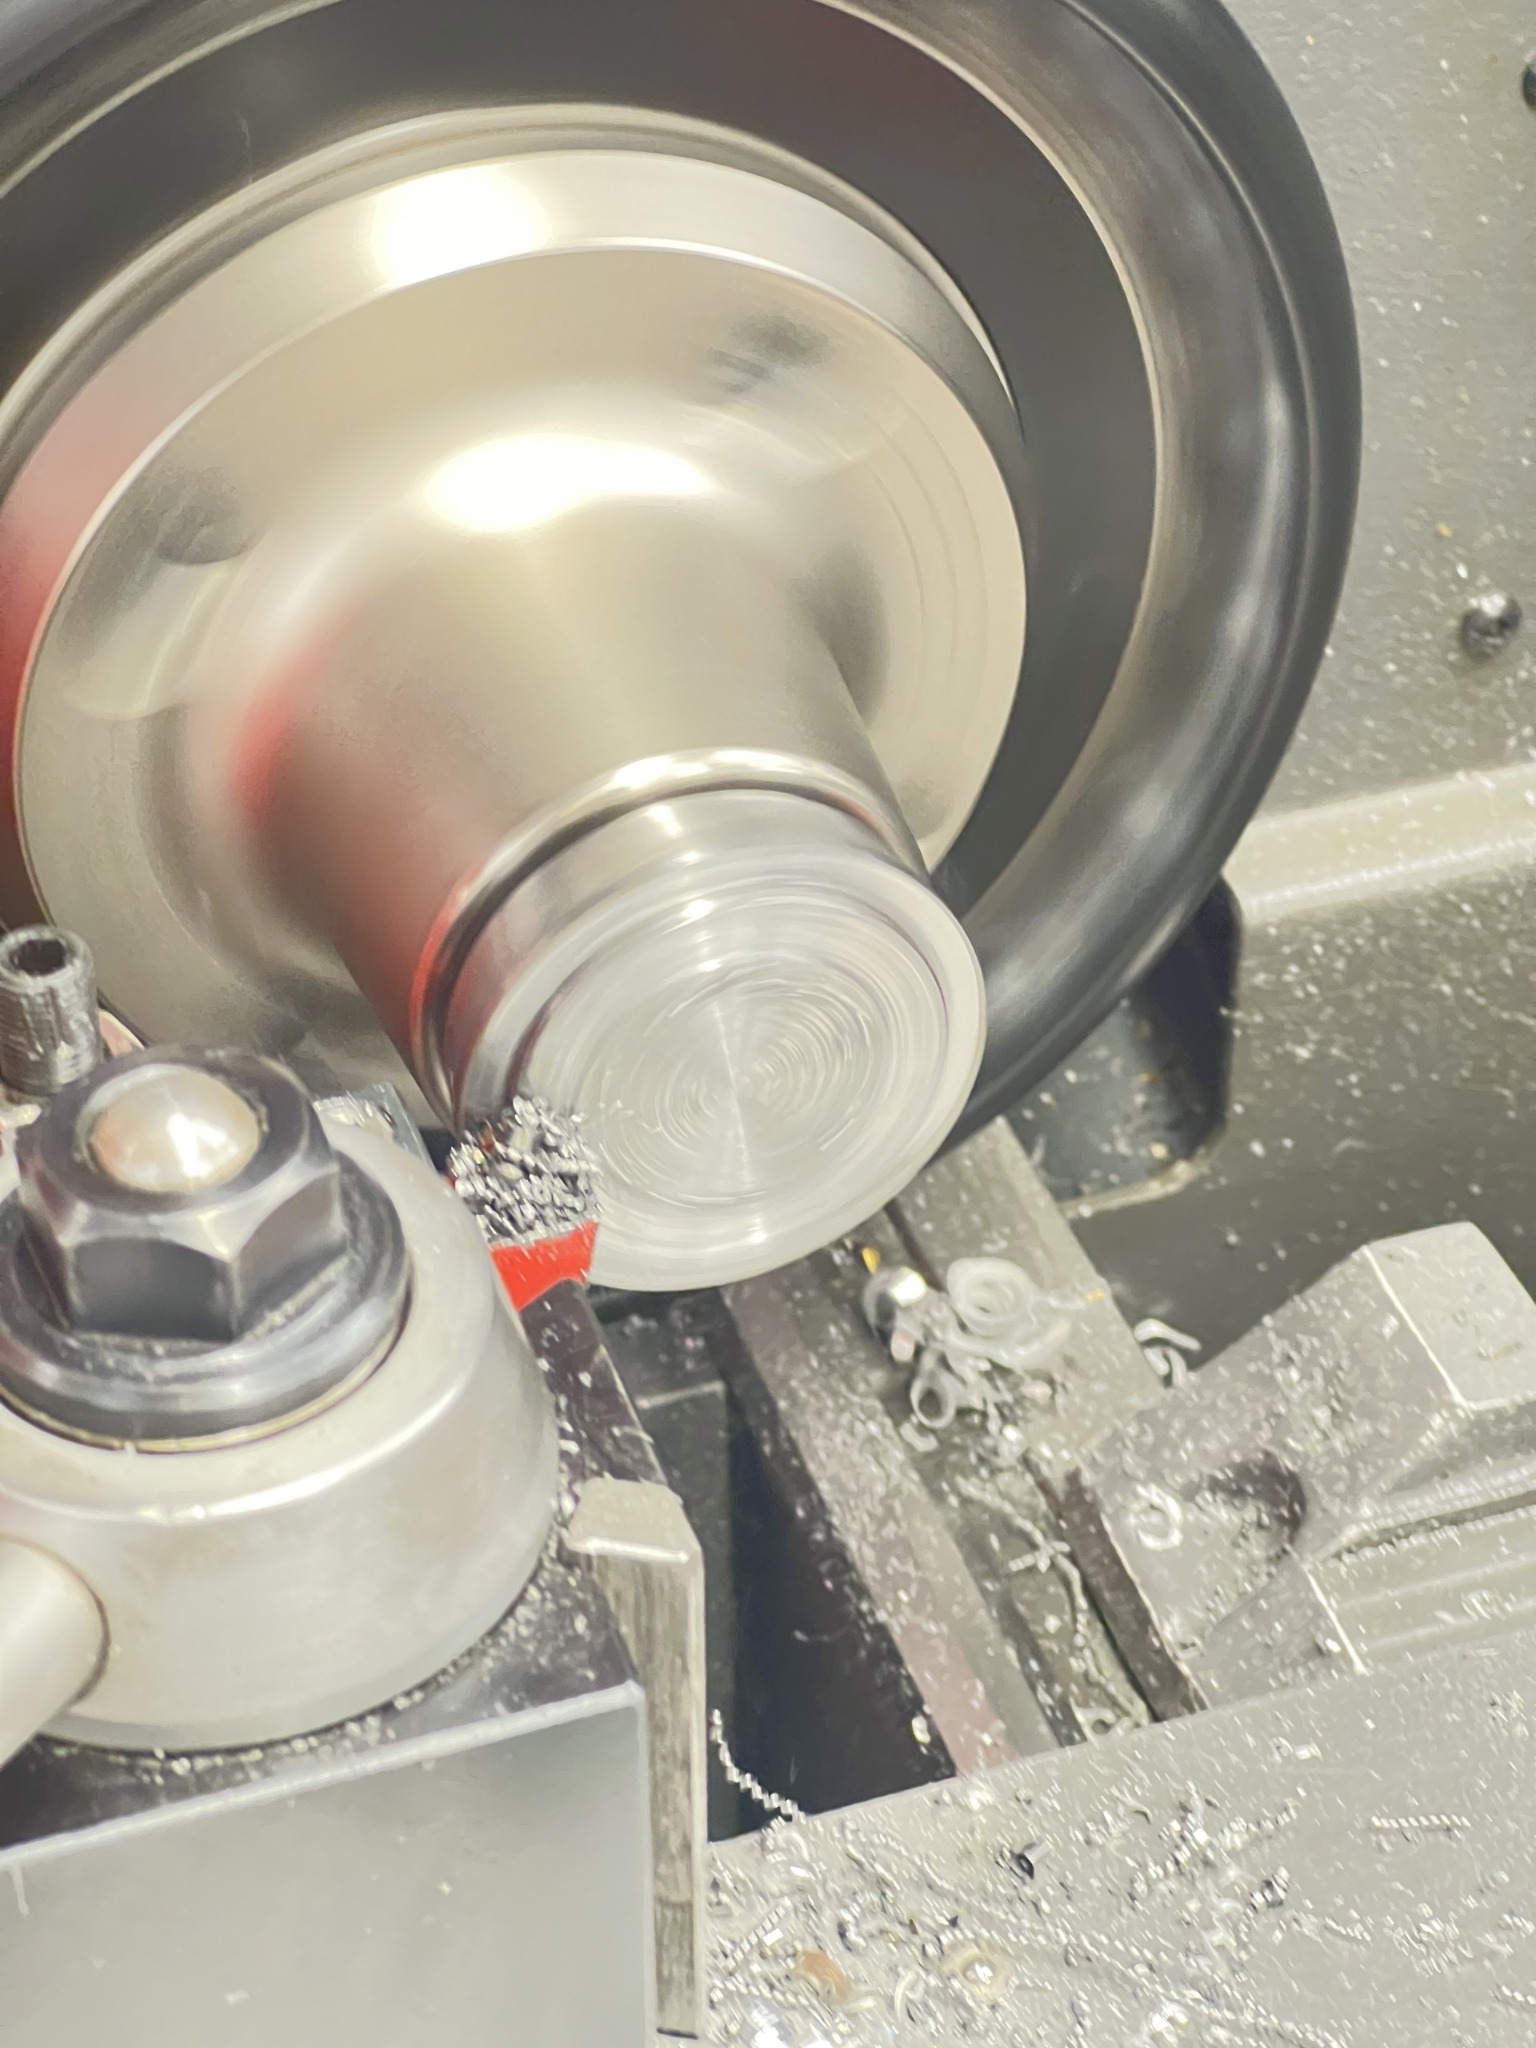
- Sample preparation (face-cut to target thickness; polishing workflow).
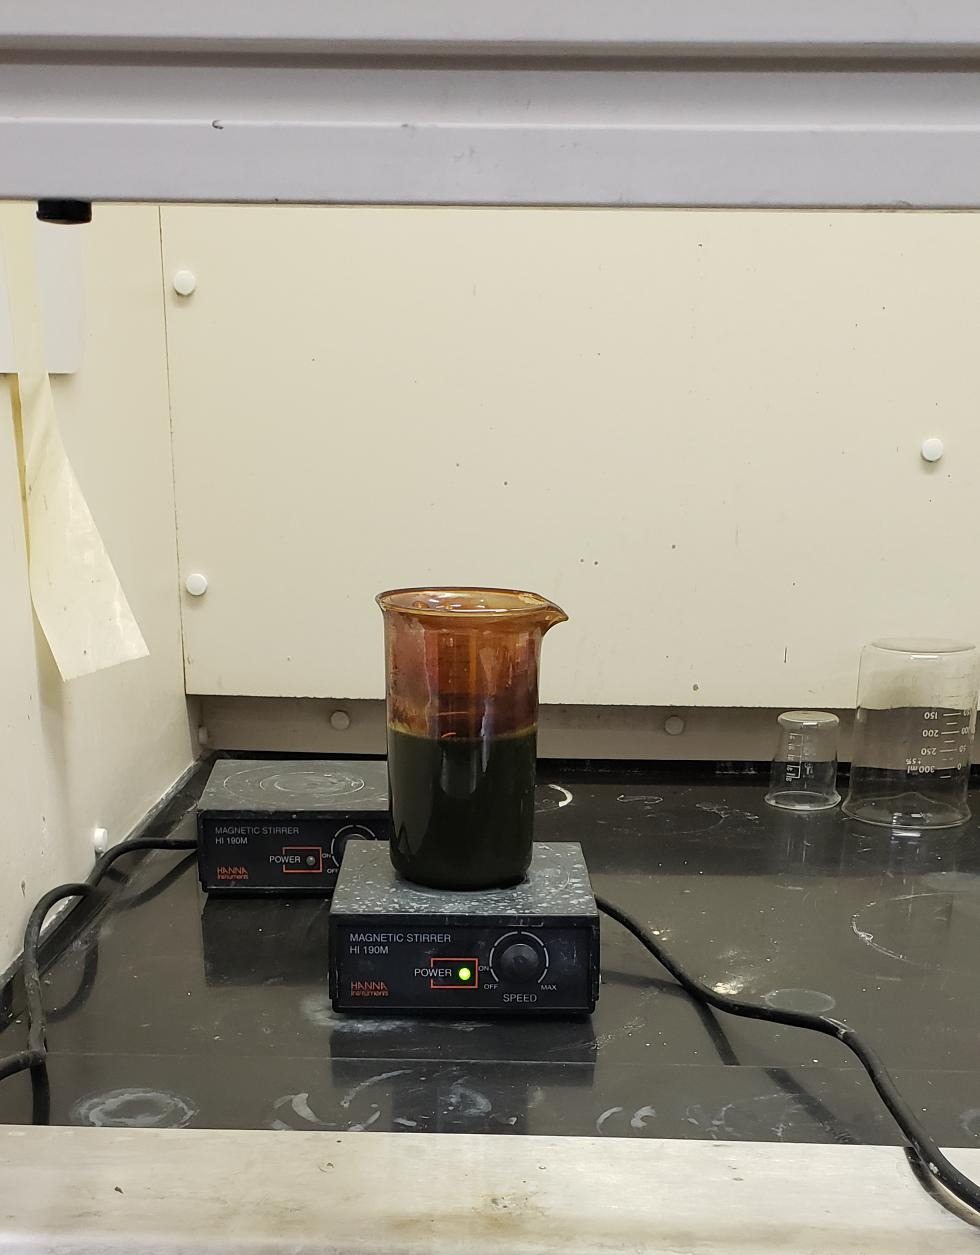
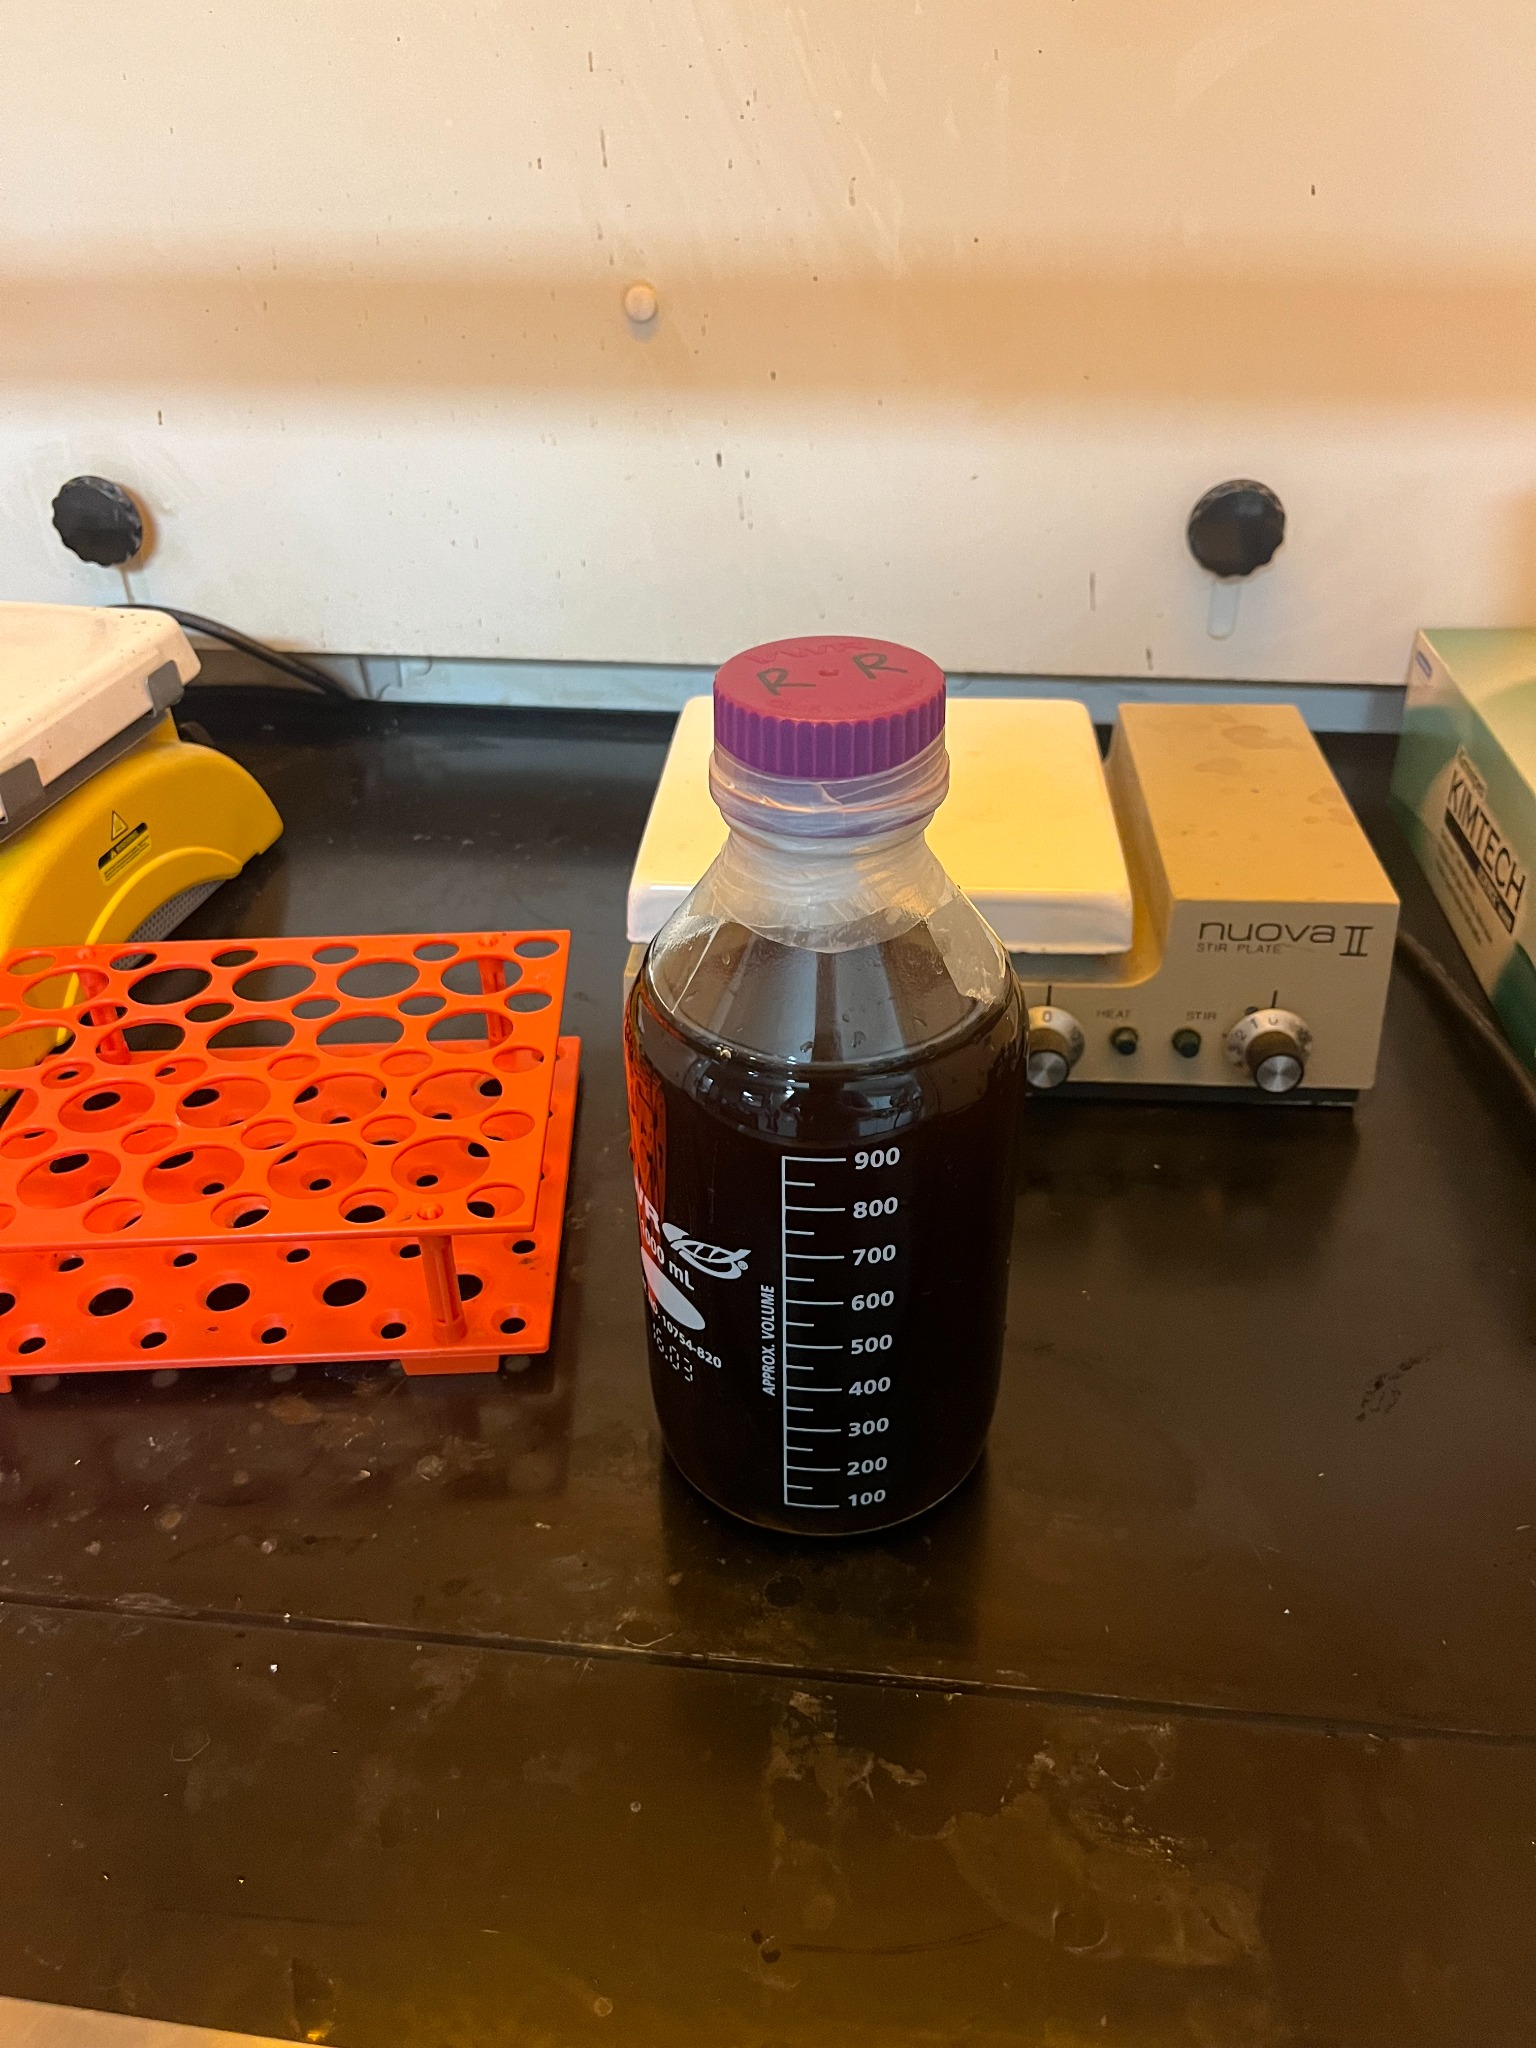
- Tribometer operation (RFW160) and lubricant preparation (micro-balance, sonication).
- Practice and production runs (e.g., PAO at RT, 5 Hz, 5 N, 300 s), data logging, fixture setup.
- Profilometry scheduling, environment control, and experiment documentation.
Outcomes
- A structured test matrix and repeatable RFW160 procedure for PAO/IL/mGO conditions.
- Baseline CoF/wear datasets for model training & comparison.
- Literature-aligned framework to evaluate ionic-liquid + graphene-derivative benefits.
Advised by Dr. Chang-Dong Yeo · Research support by Yeonjin Jung, PhD (2024) · Fall 2023
RFW160 Tribometer
Reciprocating ball-on-flat system for controlled load, frequency, stroke, and temperature, with software DAQ for real-time CoF. Testing followed the lab’s RFW160 SOP (cleaning, jig setup, load application, lube dosing, environment control, and data capture).
Lubricants & Additives
- PAO (polyalphaolefin) baseline.
- Ionic liquid blends (per lab literature context).
- Graphene-derivative (mGO) additive trials and dispersion practices (weighed + sonicated).
Surface roughness tracked (Rq) in logs; environment recorded (°C, %RH).
Test Procedure (Condensed)
- Power-up & cooling: Tribometer on; motor/heater as needed; water circulation engaged.
- Cleanliness: Dry wipe → acetone → IPA; compressed air as needed.
- Fixture & alignment: Sample rotation/position set; cross-tighten holder screws; install fresh ball jig.
- Lube dosing: ~2 drops via transfer pipet per run (single-use pipet).
- Set points: Stroke neutral, apply dead weight, lower ball smoothly; configure frequency, load, temp, duration.
- Data capture: Clear graphs, zero forces; start run; save raw data and metadata.
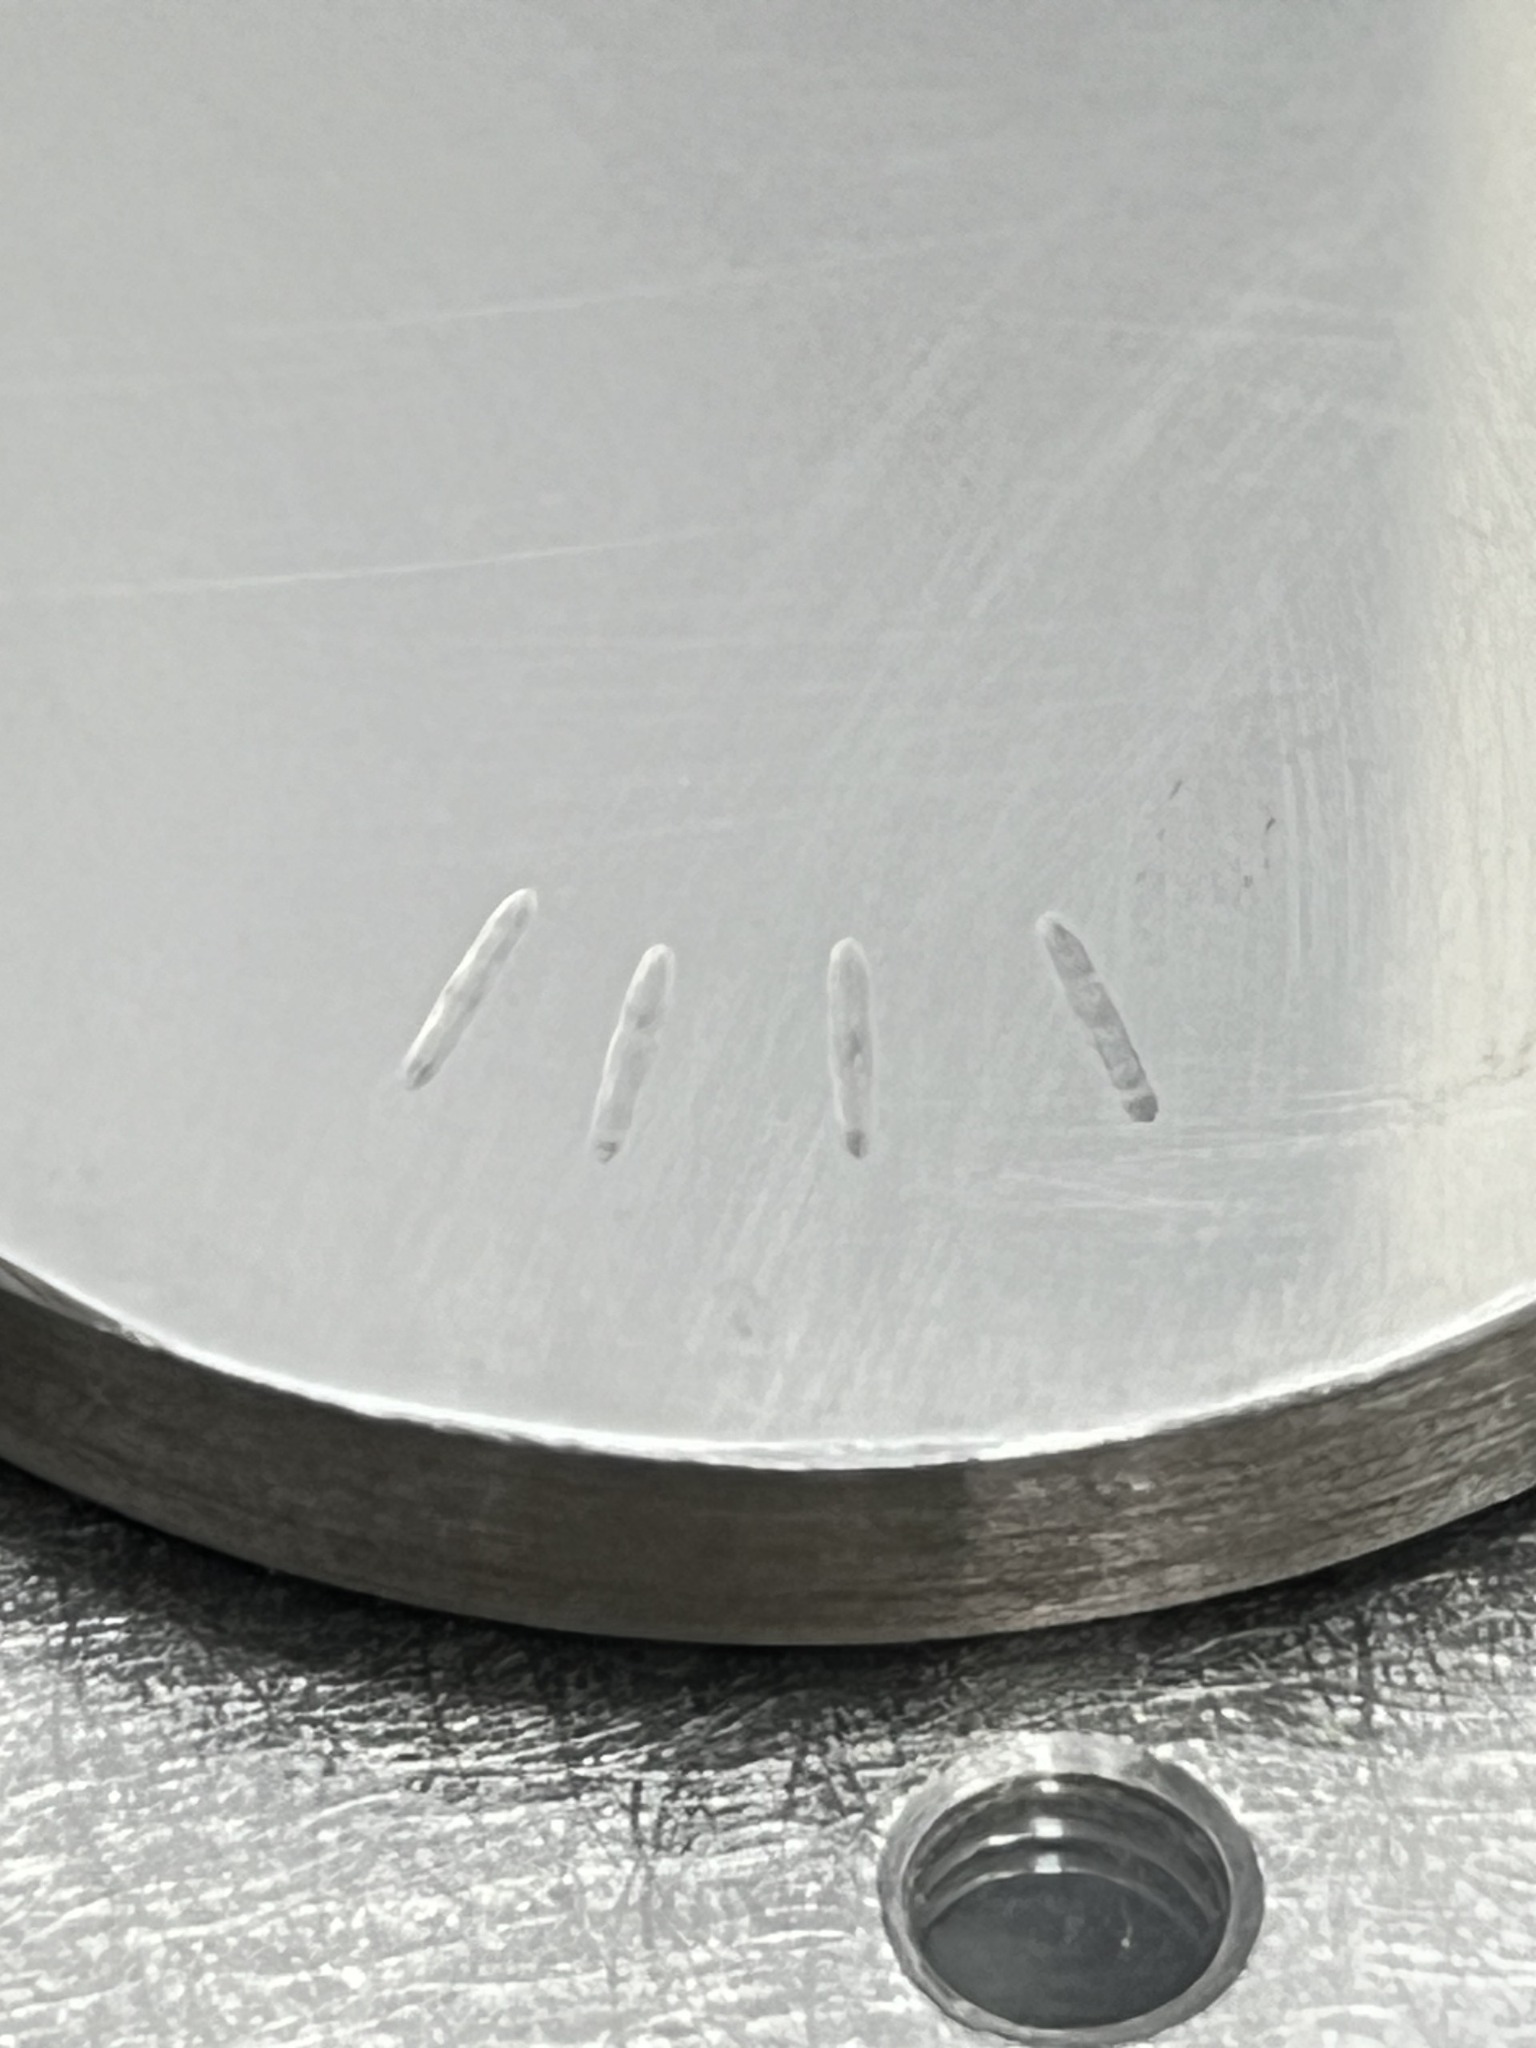
- Post-test: Document wear track index; profilometry/SEM queued; log environment and notes.
Operating
- Load (N), Frequency (Hz), Stroke (mm)
- Temperature (°C), Speed (mm/s)
- Duration (s)
Specimens
- AISI 52100 ball on polished steel sample
- Surface finish tracked (Rq nm)
- Additional polishing via M&M lab
Lab Conditions
- Ambient °C and %RH recorded per run
- Water cooling on heated tests
- Clean-room-style solvent handling
Example Log Schema
Operator / Date · Lubricant / Target temp · Material / Roughness · Test: Hz/°C/mm/N/Speed/Duration · Environment °C/%RH · File naming
Consistent logging keeps experiments searchable and ML-ready.
Selected Results
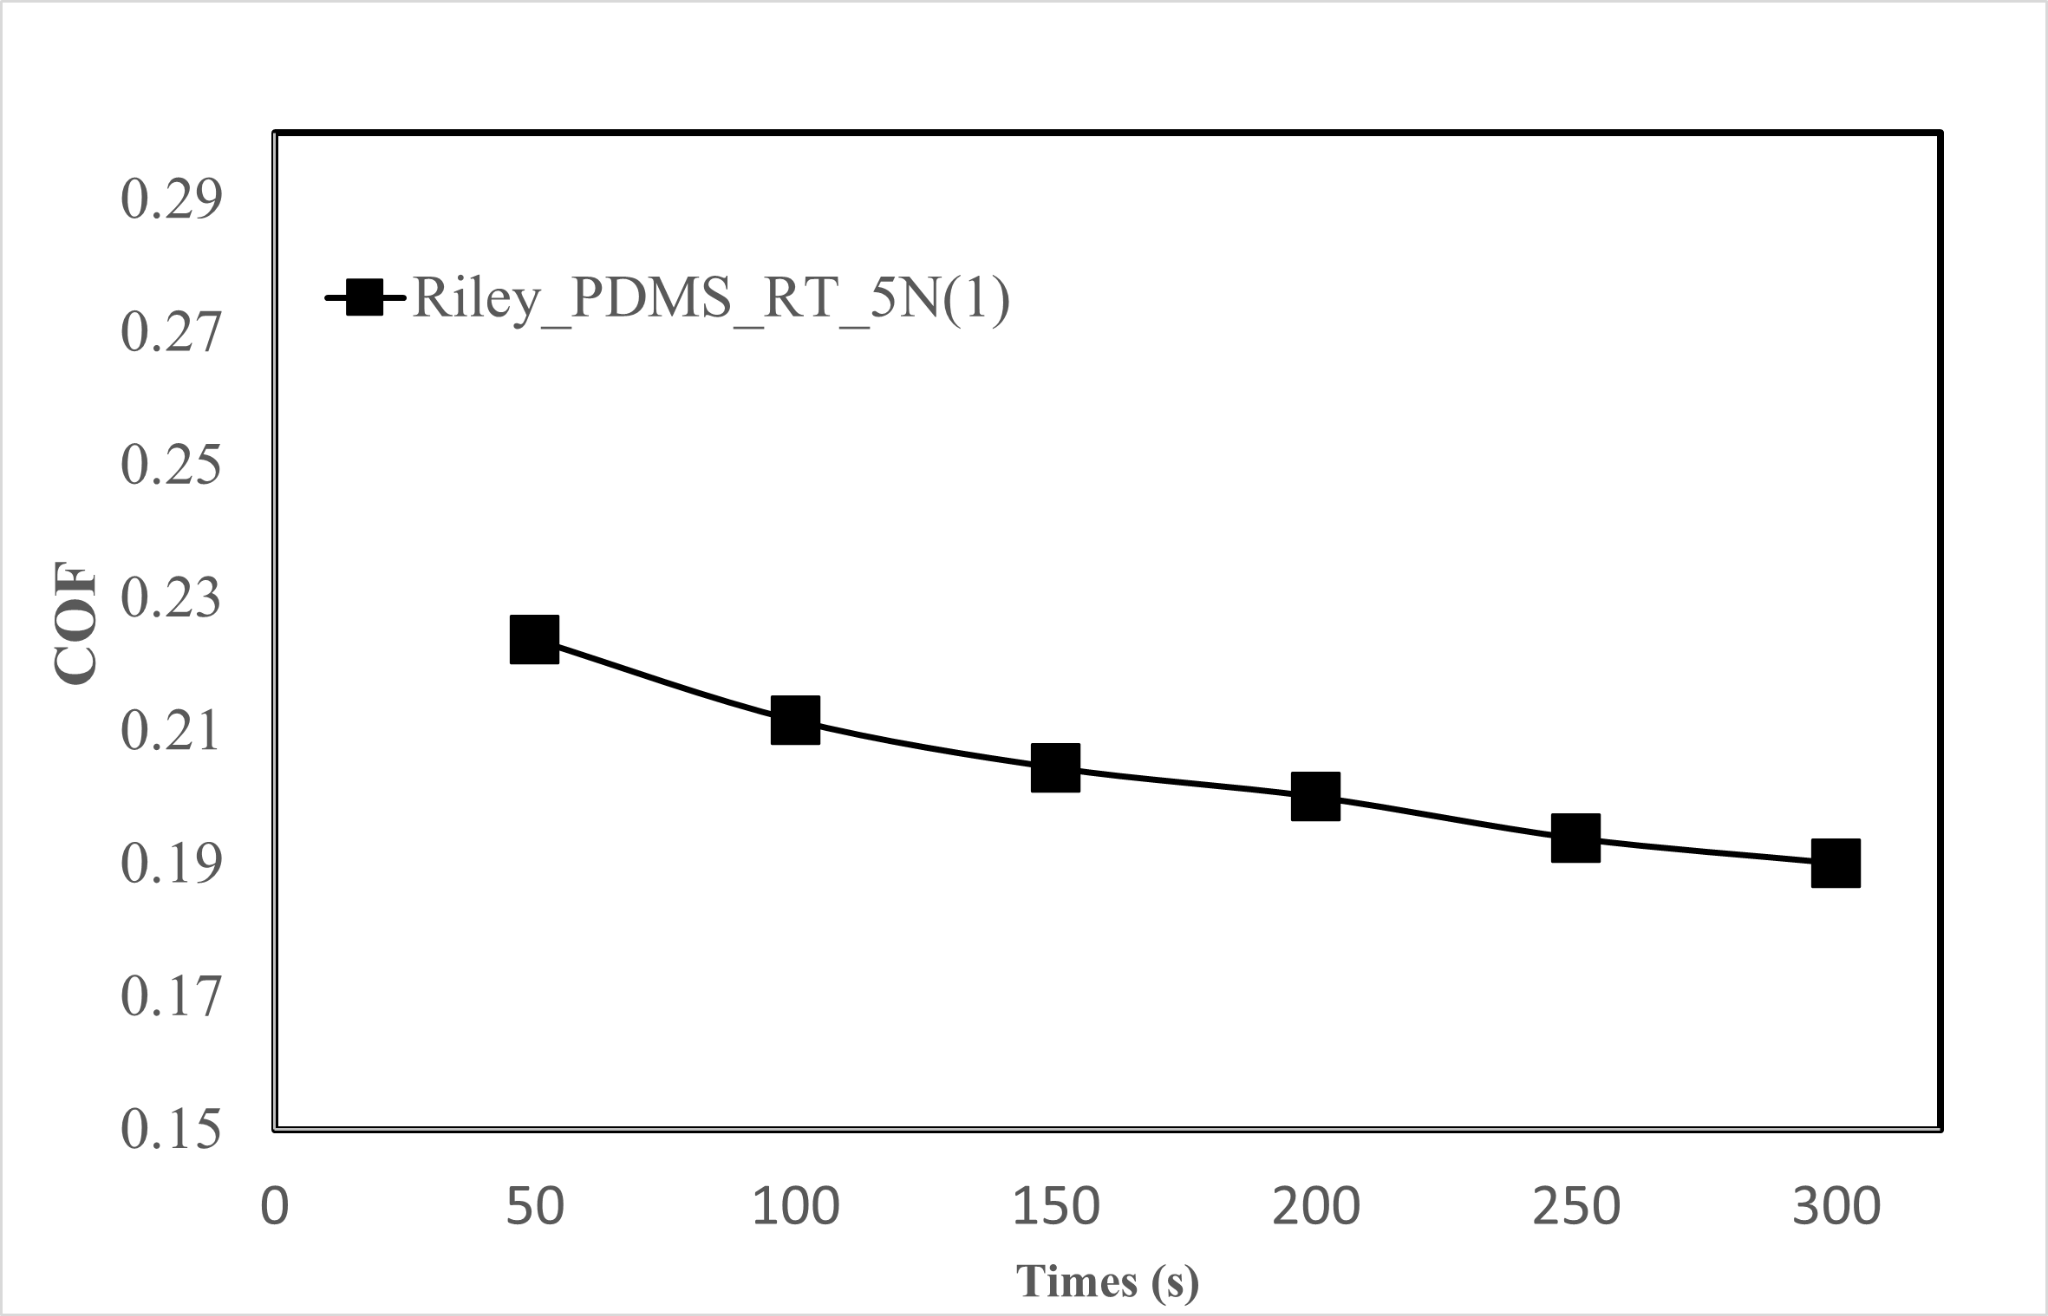
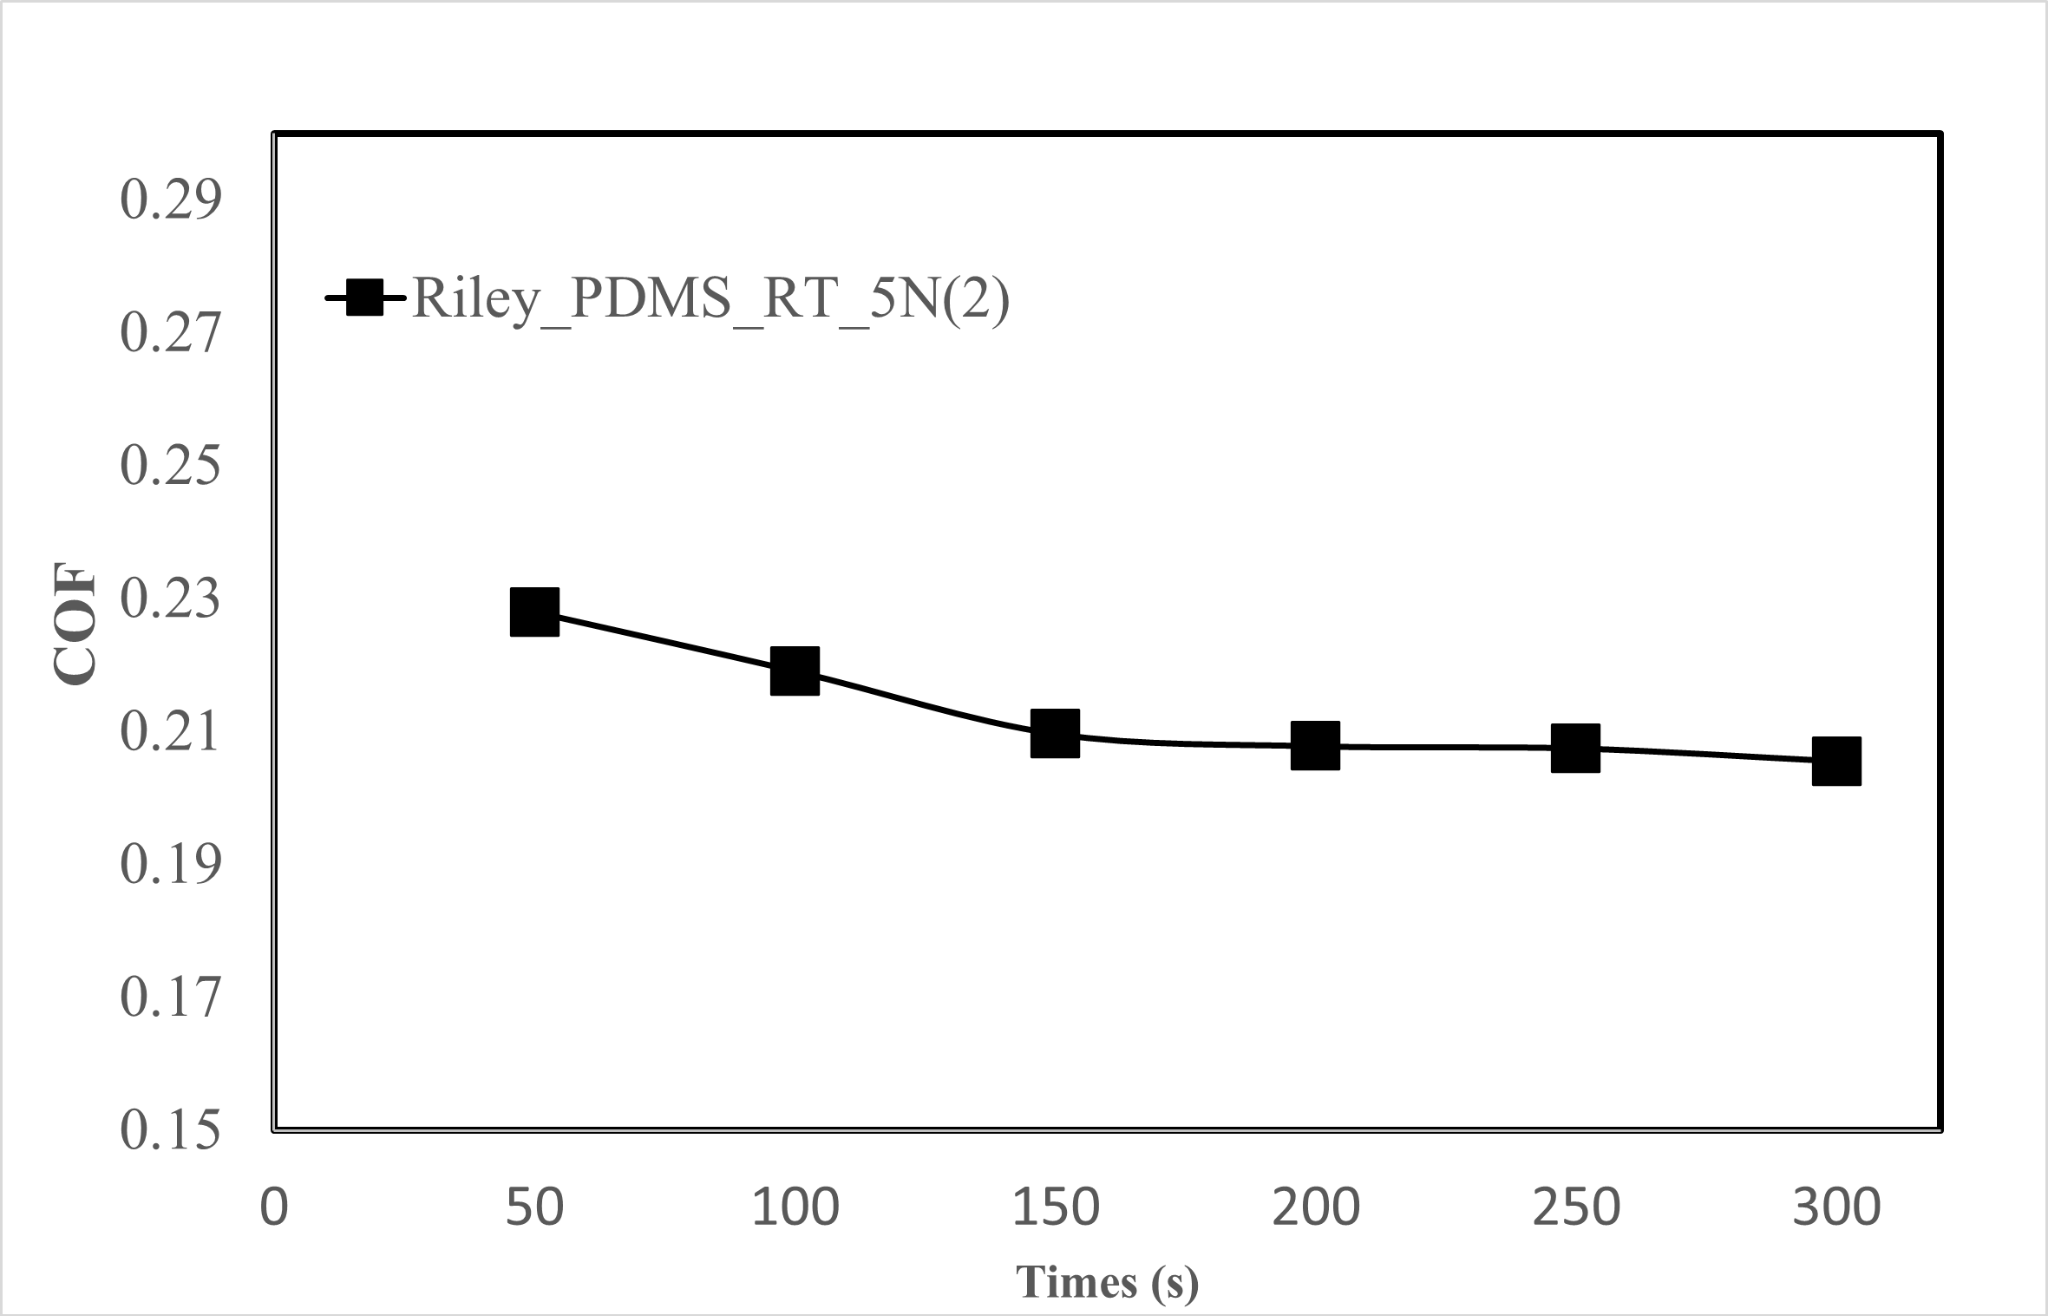
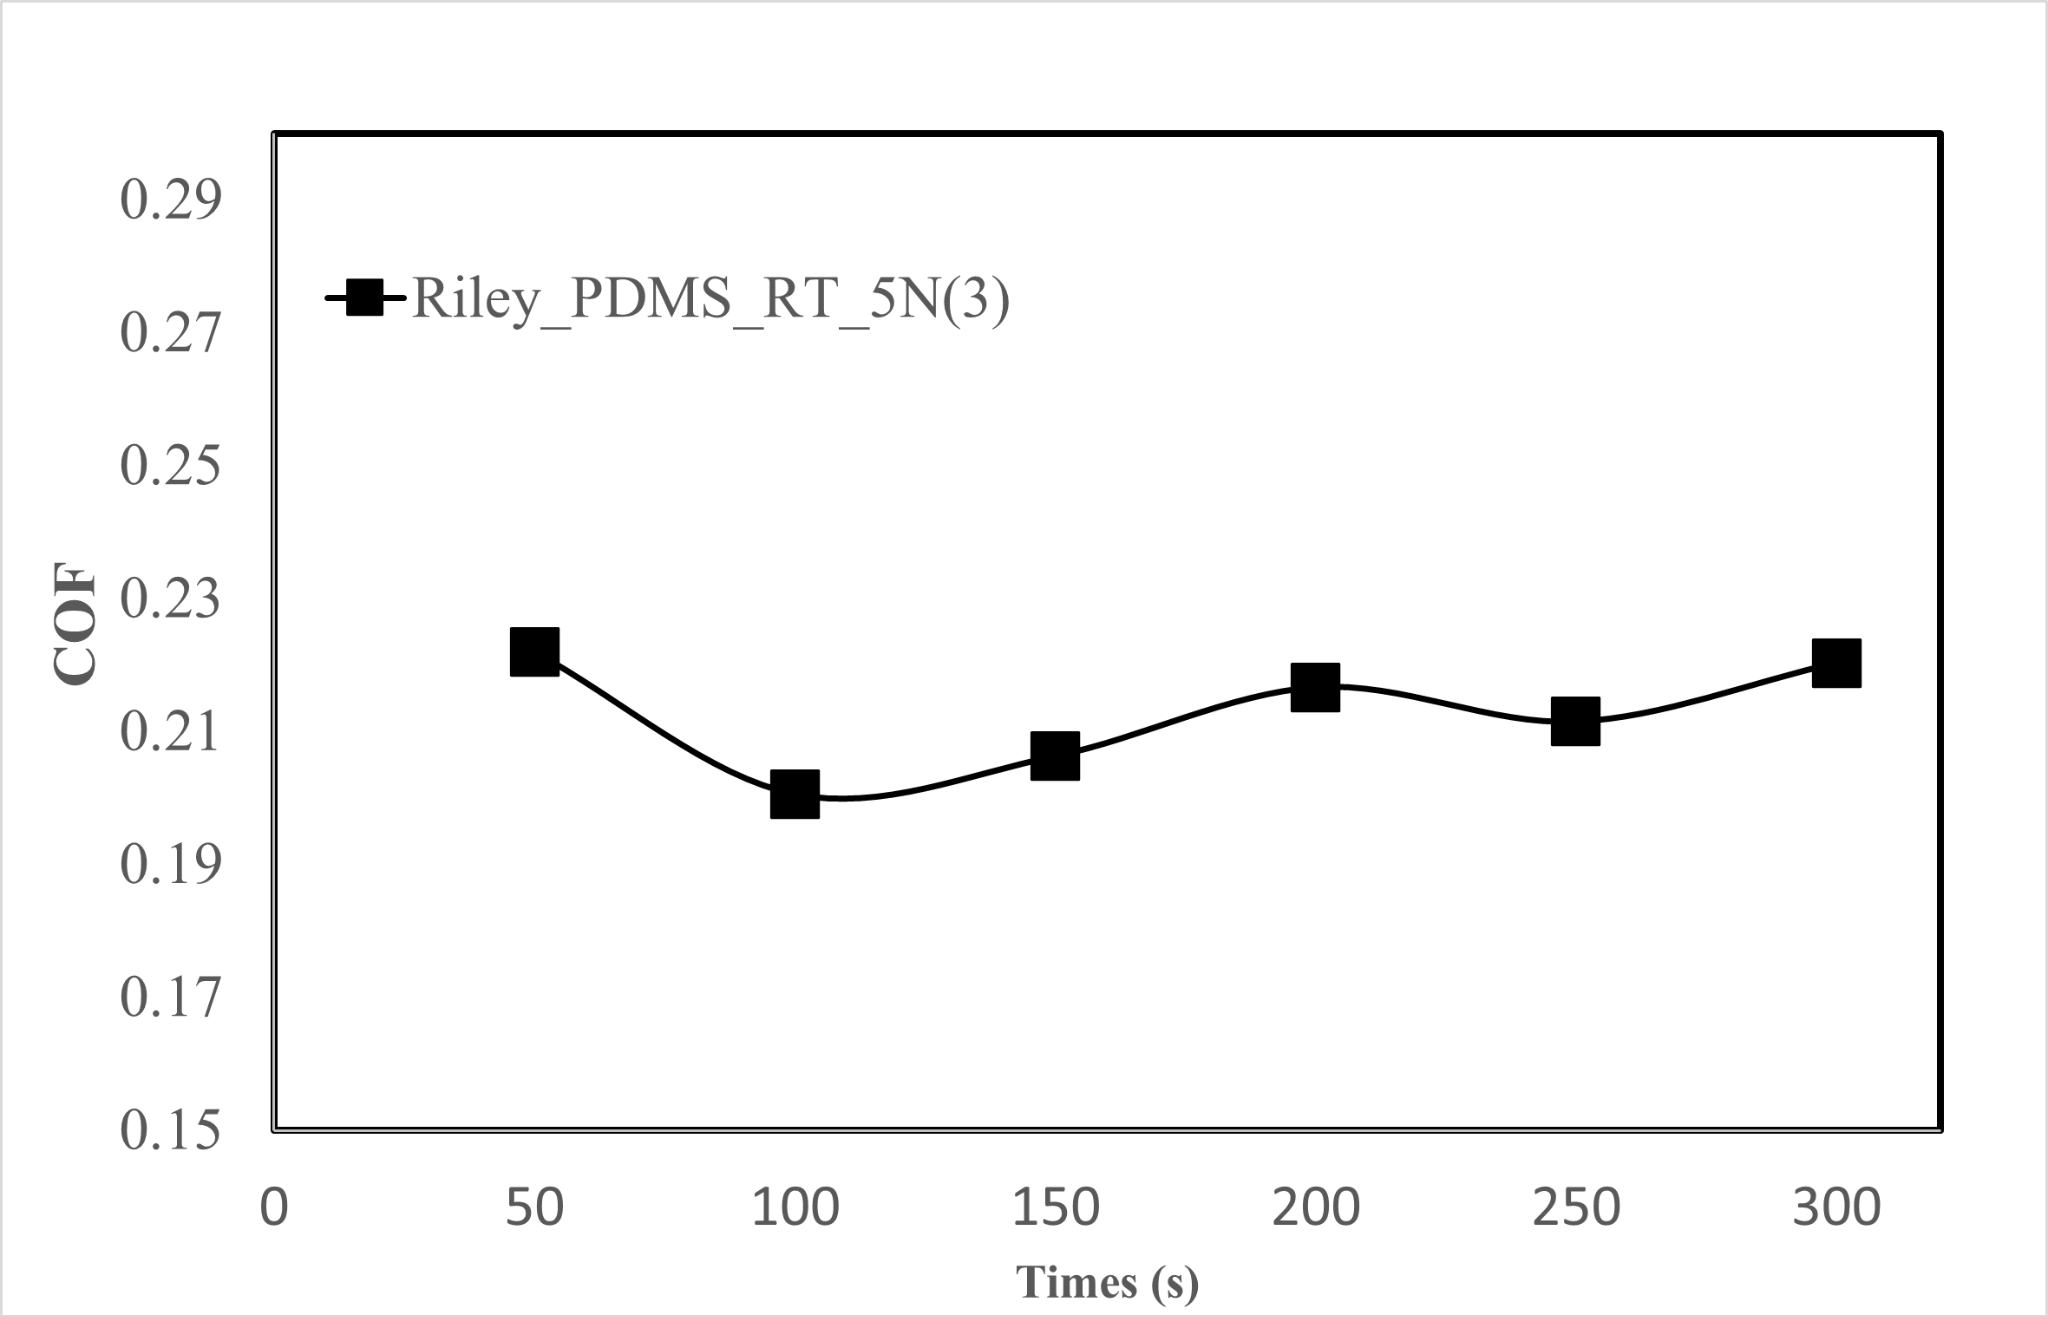
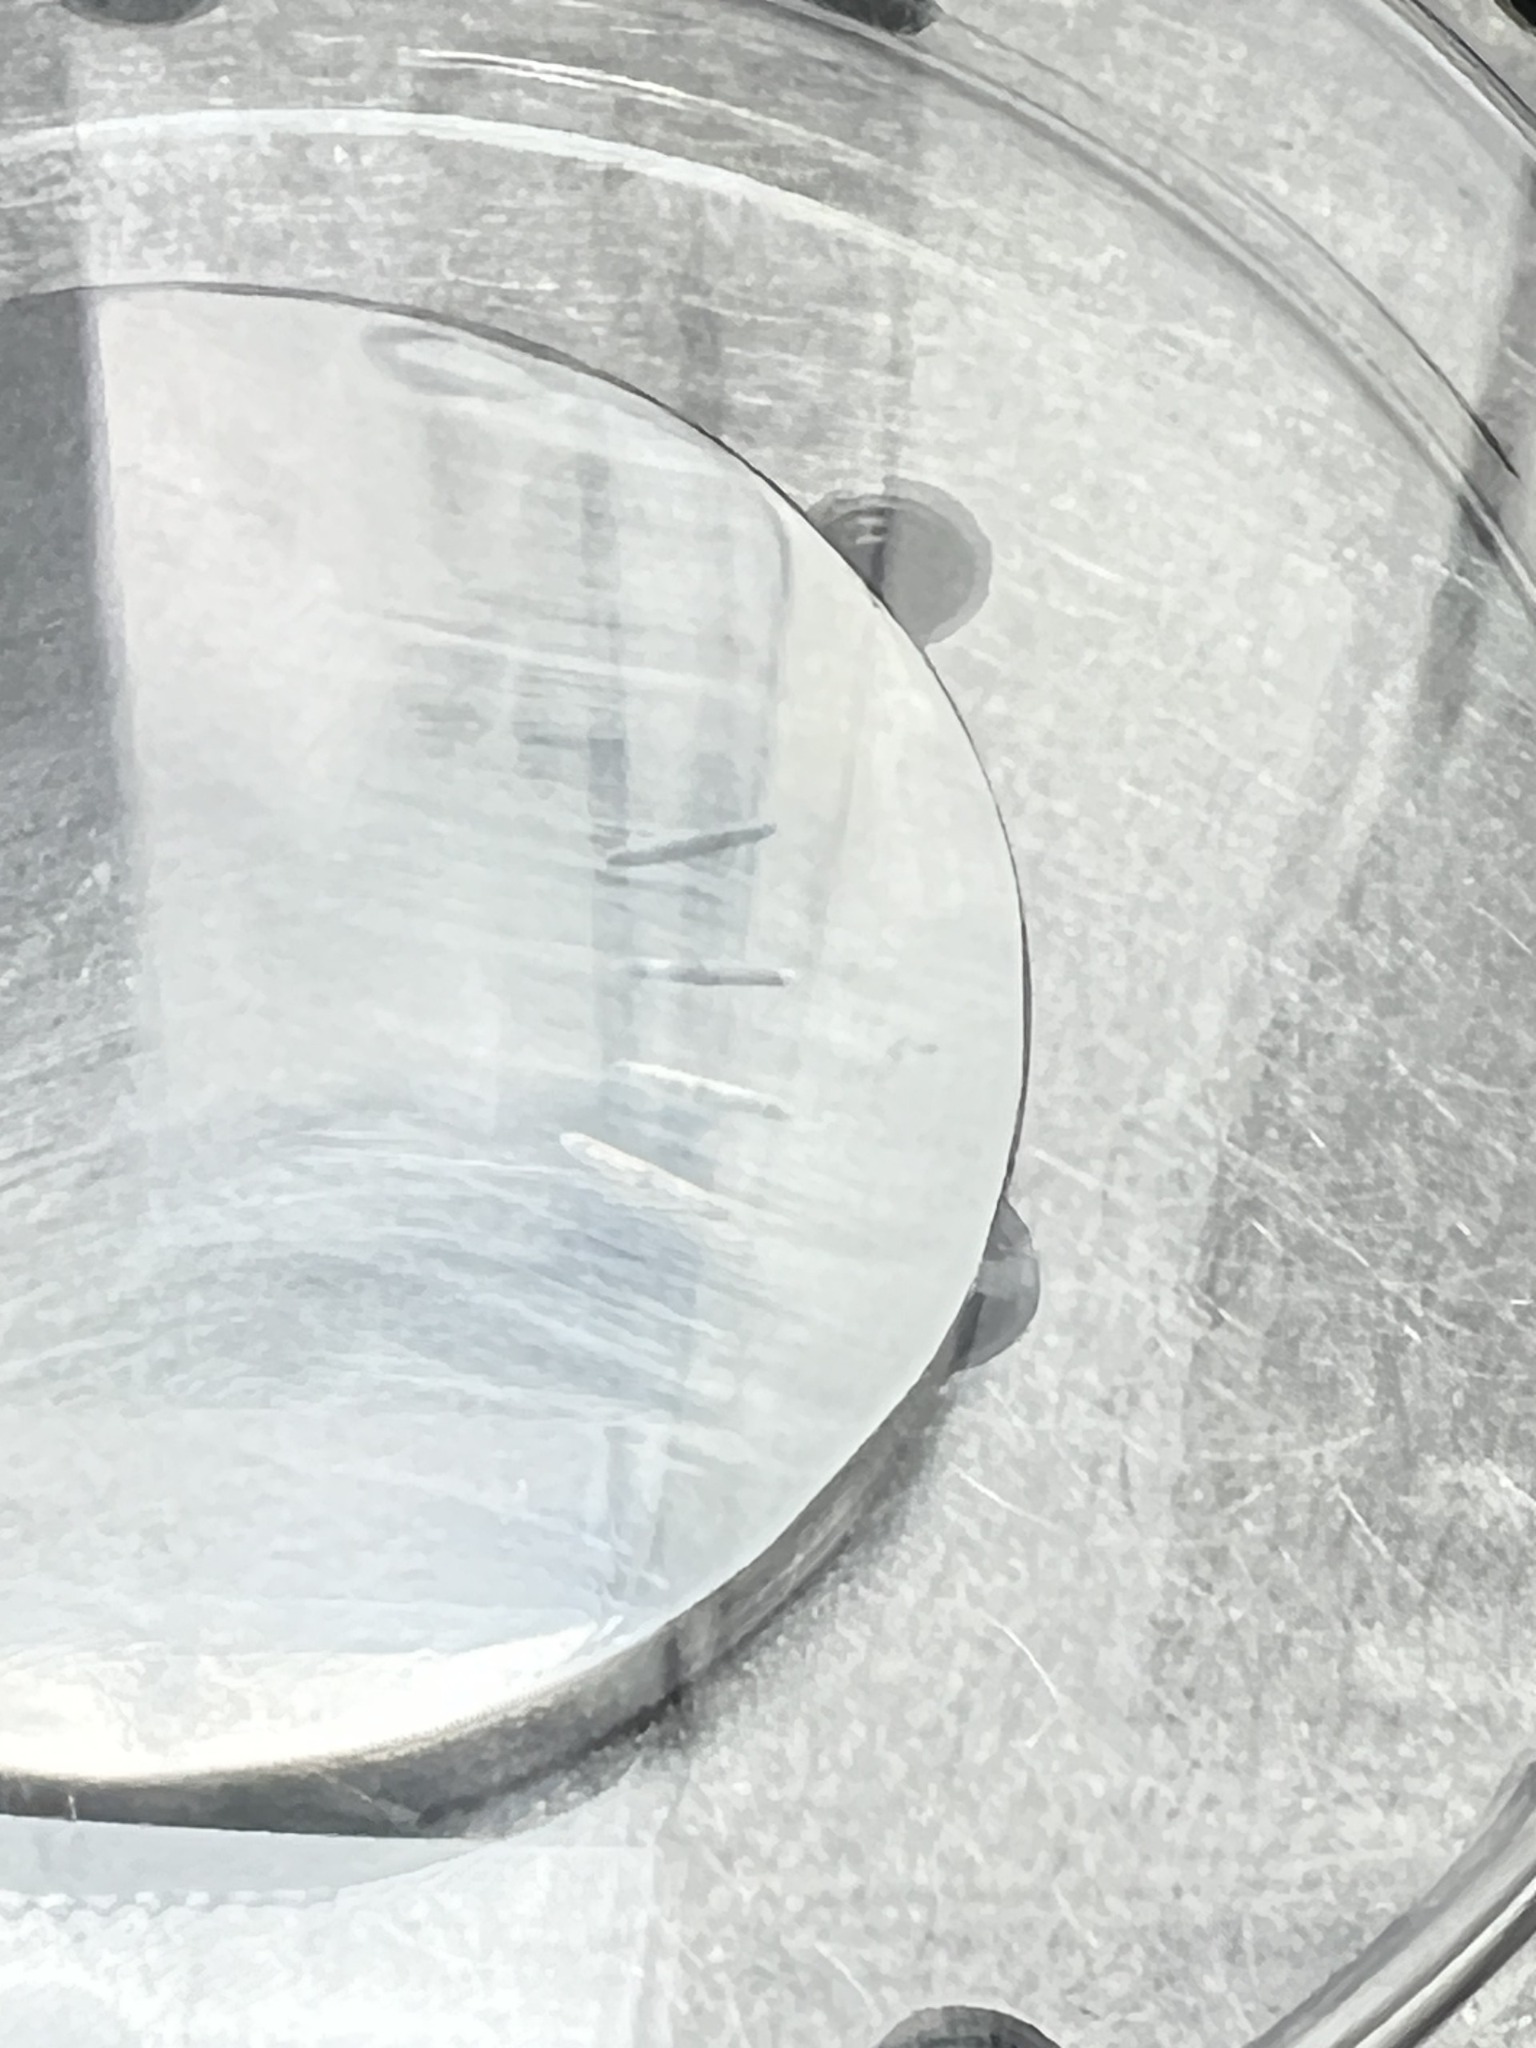
Baseline practice set at room temperature with PAO (5 Hz, 5 N, 300 s). Figures show the combined result with error bars and each individual run, followed by process photos (synthesis ⇢ sample prep ⇢ wear features).
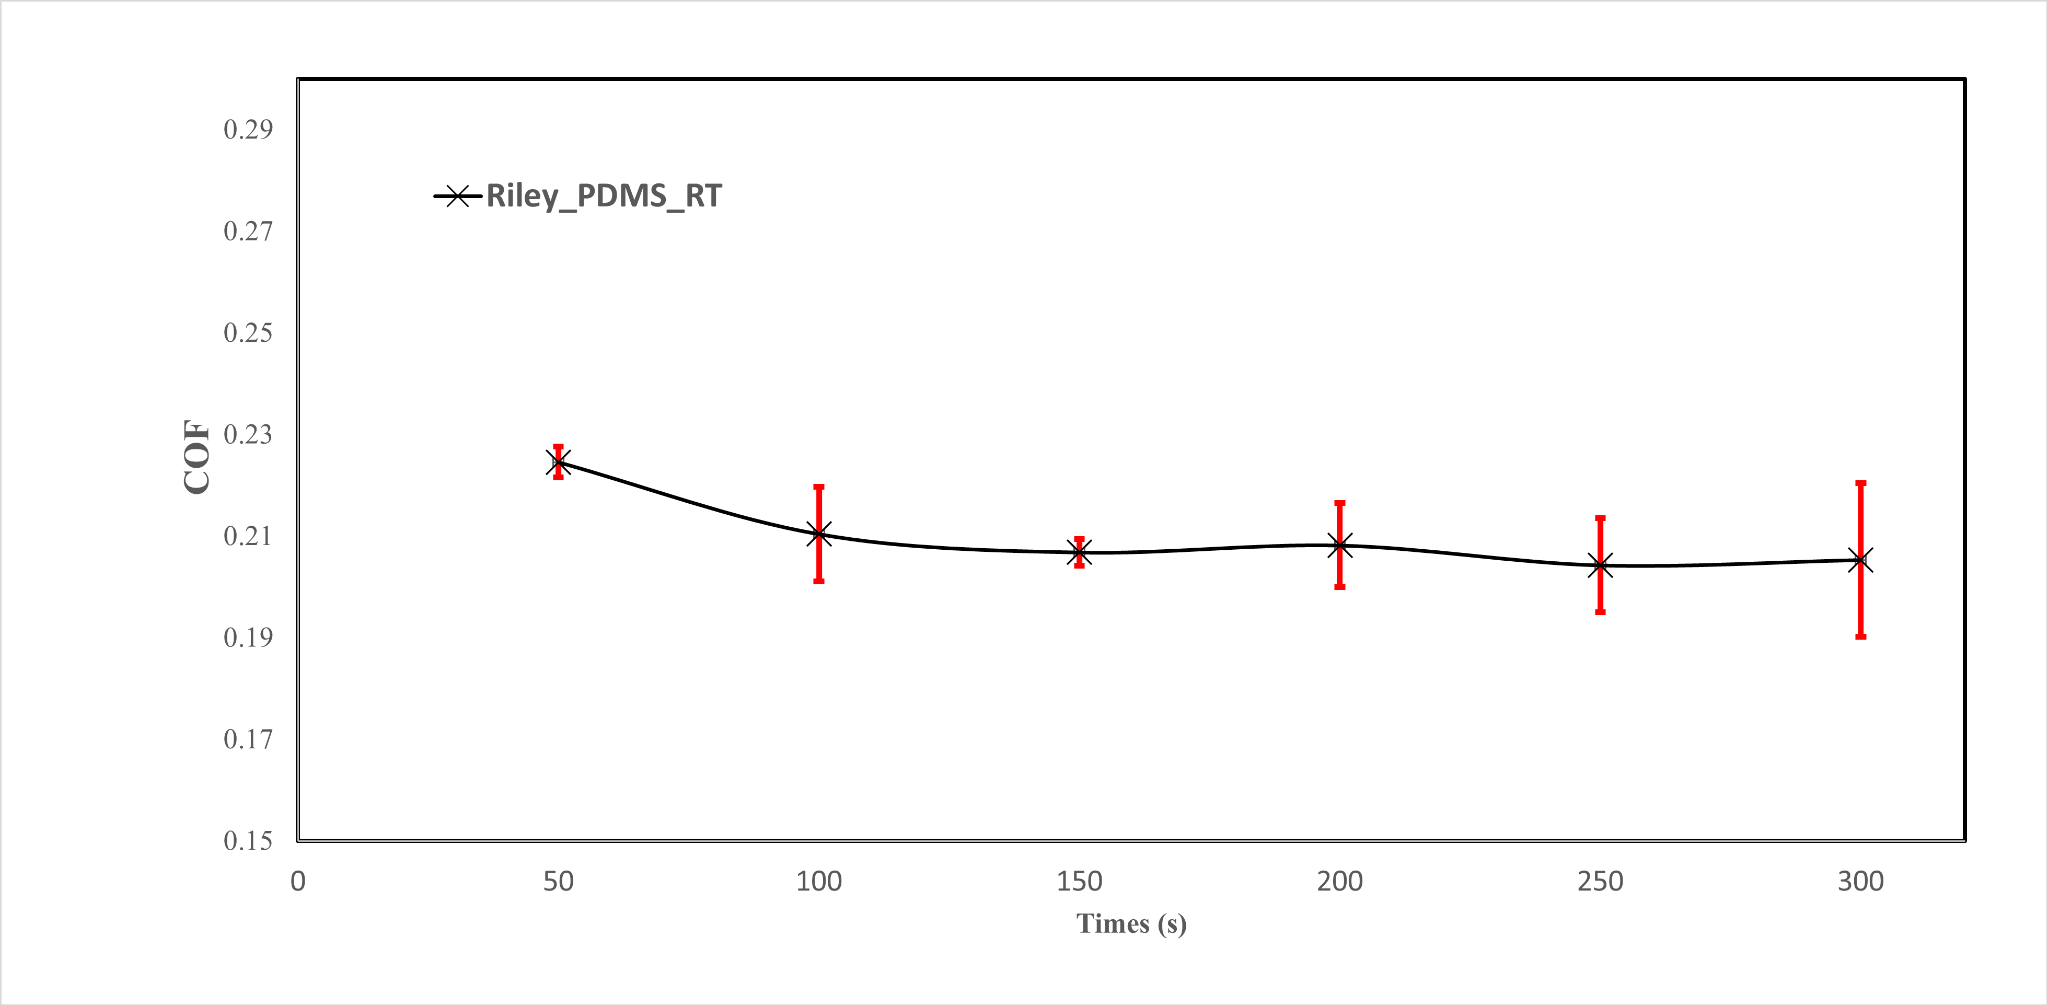
Notes on Repeatability
The combined plot in Figure 1 represents three replicate runs under identical test conditions, revealing a slight running-in behavior at the start of each run, where microscopic surface asperities wear down and the coefficient of friction (CoF) settles into a steady state. The close overlap of the curves demonstrates tight repeatability, meaning the tribometer setup, lubrication method, and sample preparation produced consistent results between runs.
Test conditions:
• Lubricant: Polyalphaolefin (PAO) base oil
• Temperature: Room temperature (RT)
• Frequency: 5 Hz reciprocating motion
• Normal load: 5 N applied load
• Test duration: 300 s per run
• Contact pair: AISI 52100 steel ball on polished steel flat
• Lubrication protocol: Fresh dose of lubricant applied prior to each run
Achieving this level of repeatability required careful specimen preparation, precise test parameter control, and consistent lubrication delivery, all of which are critical in tribology research to ensure that observed trends are due to material or lubricant behavior, not experimental variability.